Key Use Cases
Tools in Detail
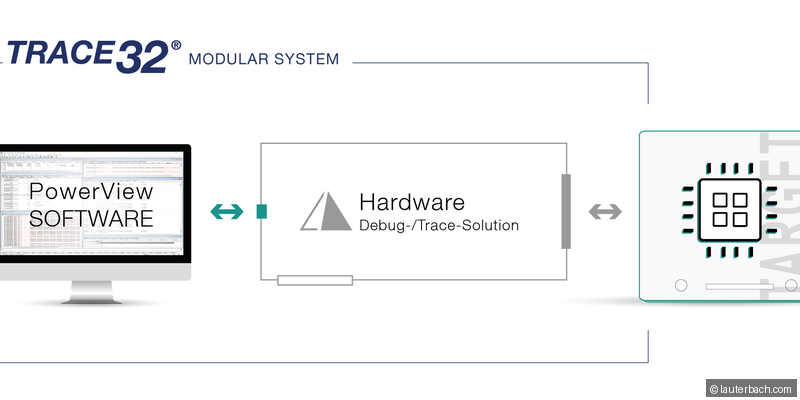
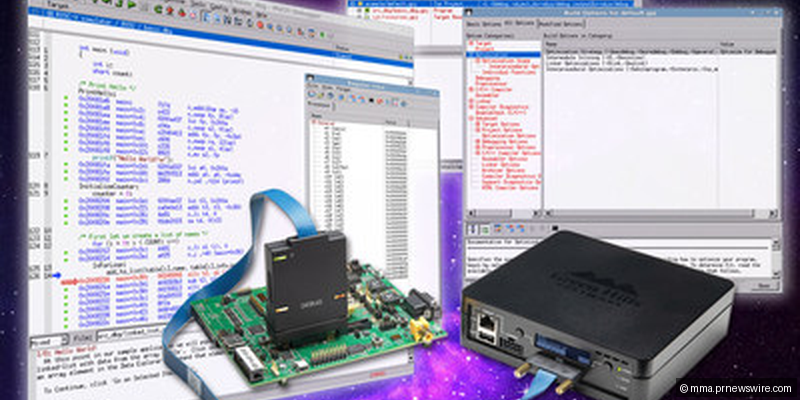
Lauterbach TRACE32
The industry-standard debugger for automotive ECUs. Supports every major MCU family (AURIX, S32K, RH850, Zynq). Provides JTAG/SWD access, trace recording, code coverage, and flash programming.
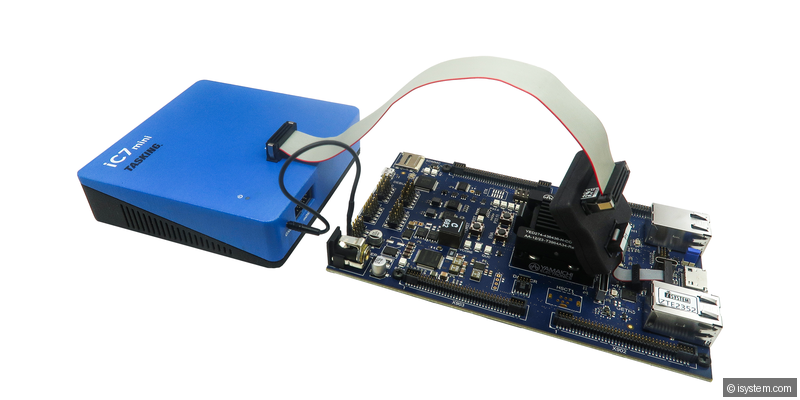
iSYSTEM winIDEA
Full-featured debug and trace environment with strong support for AUTOSAR OS-aware debugging. Integrates with CI pipelines and provides comprehensive trace analysis capabilities.
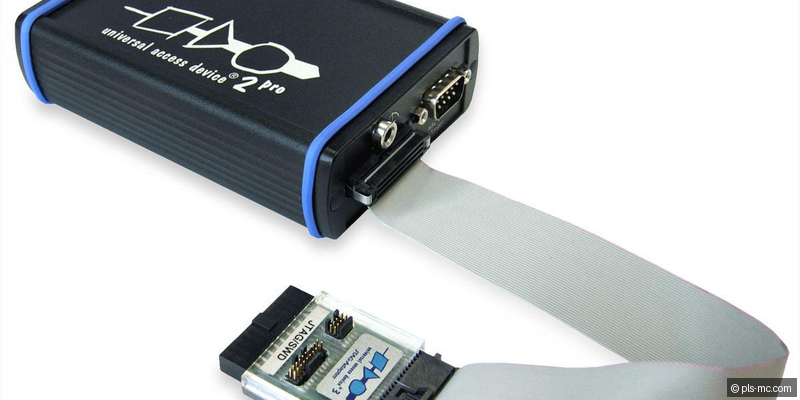
PLS UDE (Universal Debug Engine)
Debug platform with excellent multi-core support, particularly for Infineon AURIX. Provides core-synchronized debugging, trace, and coverage analysis for multi-core safety projects.
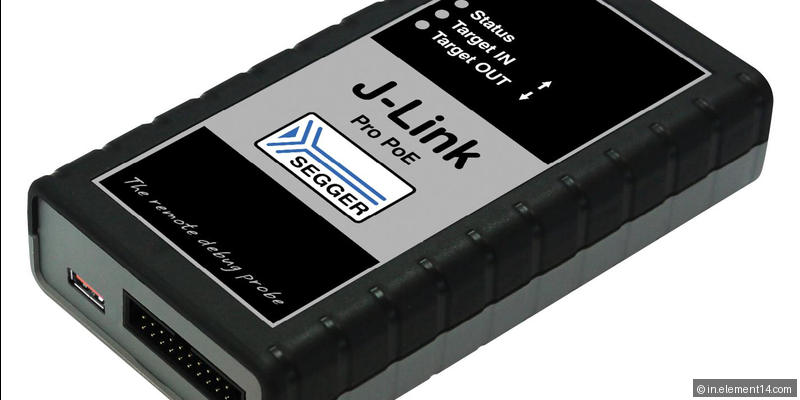
SEGGER J-Link
Popular debug probe supporting ARM Cortex, RISC-V, and other architectures. Cost-effective with high performance, widely used in development and prototyping environments.
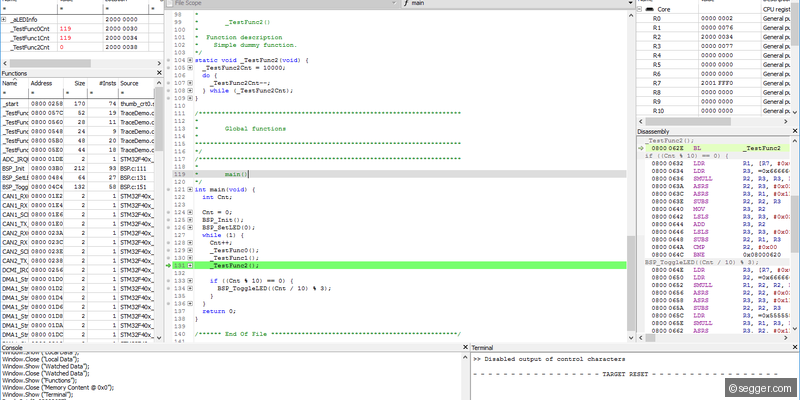
SEGGER Ozone
Standalone cross-platform debugger from SEGGER. Provides source and assembly debugging, real-time terminal, power measurement, and integration with J-Link probes.
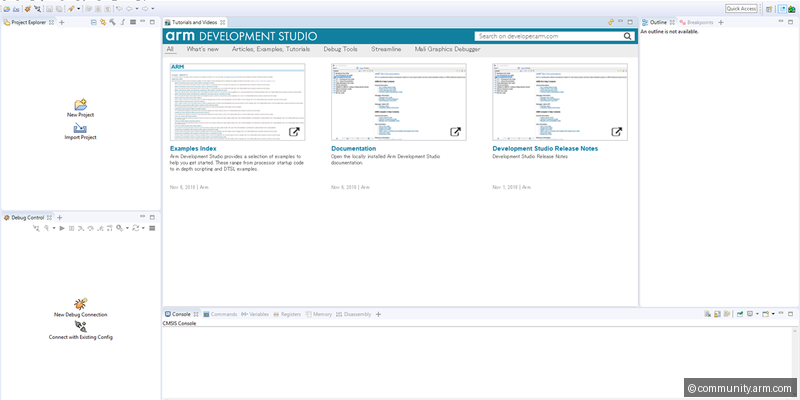
ARM DS-5 / Development Studio
ARM's official development suite for Cortex-based designs. Includes debugger, profiler, and streamline performance analyzer for ARM-based automotive SoCs.
GreenHills MULTI
Safety-certified IDE and debugger from GreenHills. Used with INTEGRITY RTOS for ASIL D projects. Provides advanced multi-core debugging and MISRA checking.
Industry Context
Hardware debugging is foundational for automotive embedded engineers, yet often underappreciated. When an ECU crashes intermittently, when a real-time task misses its deadline, or when memory corruption corrupts calibration data, the debug probe is the only tool providing definitive answers. Lauterbach holds an estimated 80%+ market share because of unmatched MCU support - virtually every automotive MCU (Infineon AURIX, Renesas RH850, NXP S32, ARM Cortex-R/M) has deep TRACE32 support that generic debuggers cannot match.
Typical Workflow
Hardware debugging spans the entire lifecycle. During bring-up, the probe is essential for flash programming and stepping through boot code. During development, breakpoints and variable watches handle logic debugging while trace recording captures execution history for timing-critical analysis. For ISO 26262, code coverage tools record exercised code paths, generating coverage reports (statement, branch, MC/DC). In production, debug interfaces may be security-locked, but during development, the probe is the engineer's most critical tool.
Selection Guide
Pro Tips
Learn Lauterbach PRACTICE scripting - automated debug scripts save enormous time for repetitive tasks.
Always set up symbol loading (ELF path, source directories) before starting a debug session.
Use trace recording for timing issues - breakpoints alter timing and can mask the problem.
For multi-core MCUs, use core-specific breakpoints to avoid stalling safety-critical cores.
When debugging ARM Cortex-M hard faults, inspect the stacked exception frame (R0-R3, R12, LR, PC, xPSR).